Bike path Surface Quality
Read our BSQ onepagers here:
Find a video describing the BSQ service here:
You are welcome to contact Hermes Traffic Intelligence to learn more about comfort measurements on your bike paths:
Follow the link below to request a quote for Bike-path Surface Quality:
Are you aware of the state of the bike paths in your area? How old is your last inspection of the bike paths, and could you benefit from getting them checked more often? Budgets for maintaining bike paths are often limited, so why not use the funds where most will benefit?
We cycle on your bike paths
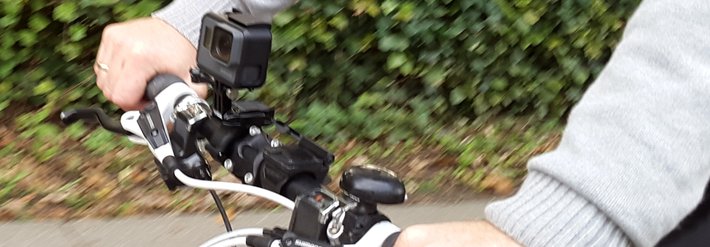
If you order a comfort measurement of your bike paths, we will ride a bike on them and you will get measurements and reports that tell you what the conditions of the bike paths are. We measure the condition of the bike paths with accelerometers coupled with a GPS device, so you can see exactly where the largest fluctuations, and thus the biggest holes, are. It's all assembled in a camera that also films the asphalt and therefore gives you the best overview of the measurements.
Comfort measurements with no sweat
We carry out the comfort measurements in the following steps:
- You find out which sections of the bike paths you want to measure.
- Together, we make instructions for the cyclist who is to perform the measurements. This describes which type of bike to ride, how to mount the camera, when the measurements are to be performed, speed, etc.
- We make sure to ride a bike on the selected bike paths.
- The collected data are processed, and results, as well as videos, become available to you via the HOTS platform.
- You access the data and determine the areas that require attention.
Your data on HOTS
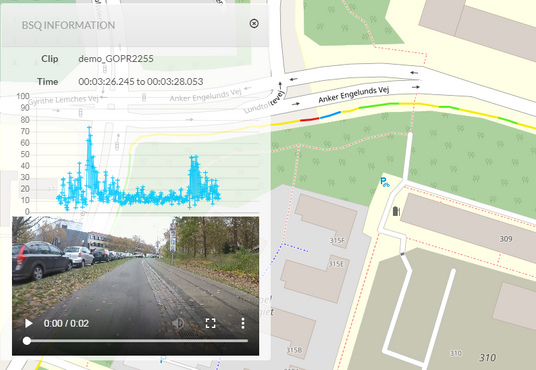
The screenshot to the right shows how data are presented in HOTS (version 1.1.0). The stretch is divided into 10 metre pieces (the size is adjustable), and each stretch is coloured. Colours indicate the quality measured: green is for surfaces with little or no bad spots, yellow is for surfaces with a few spots, and red is for surfaces with bad quality. When clicking a piece of stretch the actual measure of that stretch is shown in a graph together with video footage from that stretch. This allows you to see the bumps or potholes that were actually measured.
Schedule maintenence
With measurements and videos, you get an overview of the areas to address. You could also consider to:
- get mileage / positioning in areas that are most in need of maintenance. It may be easier to compare with for example road permissions, so the responsibility for poor asphalt can be placed at the right owner.
- get comfort measurements regularly, e.g. once a year, and compare the measurements with previous measurements to keep an eye on areas that typically need to be repaired.
- access measurements in your GIS system.